Difference between revisions of "Gideros Studio IDE"
m (Text replacement - "</source>" to "</syntaxhighlight>") |
|||
| (7 intermediate revisions by 4 users not shown) | |||
| Line 1: | Line 1: | ||
| − | Gideros Studio comes with an IDE, enabling faster development of applications | + | __TOC__ |
| + | |||
| + | <languages /> | ||
| + | |||
| + | '''Gideros Studio IDE is written in Qt, using Qt Creator IDE and SDK.''' | ||
| + | |||
| + | === <translate>Gideros Studio IDE</translate> === | ||
| + | <translate><!--T:1--> | ||
| + | Gideros Studio comes with an IDE, enabling faster development of applications. Gideros Studio helps you organize resources, prevent mistakes and provide shorter ways throughout development process. During the build, Gideros Studio translates your code from Lua to native code of the targeted platform. | ||
When you start Gideros Studio, it opens in the welcome mode and shows the dashboard. Here you can do the following: | When you start Gideros Studio, it opens in the welcome mode and shows the dashboard. Here you can do the following: | ||
| − | + | * Create and open projects | |
| − | + | * Read Getting Started Guide | |
| − | + | * Read Reference Manual | |
| − | + | * Open all recent projects and sessions | |
| − | + | * Open tutorials and 30+ example projects | |
| − | + | </translate> | |
| − | |||
=== Menu Organisation === | === Menu Organisation === | ||
| − | + | The menu organization is straightforward and easy to understand. Below, you can see each menu and what they do. | |
# File menu: Here you can open, save, close a project, or maintain your recent projects. This is also the place where you export your code to Eclipse or XCode. | # File menu: Here you can open, save, close a project, or maintain your recent projects. This is also the place where you export your code to Eclipse or XCode. | ||
| Line 21: | Line 28: | ||
# Help: Includes a link to Developer Center and Reference Manual (API documentation). | # Help: Includes a link to Developer Center and Reference Manual (API documentation). | ||
| − | Note that you can reach many menu items by using one of the [[Menu Shortcuts]]. | + | '''Note that you can reach many menu items by using one of the [[Menu Shortcuts]].''' |
=== Project Panel === | === Project Panel === | ||
The project pane shows the project files, including all Lua files and assets like graphics and sound. All files added to the project can be seen here. | The project pane shows the project files, including all Lua files and assets like graphics and sound. All files added to the project can be seen here. | ||
| + | |||
| + | [[File:ProjectPane.png]] | ||
If you want to add a Lua file here, right click on the project name and click on "Add a new file". This will add a new Lua file to the project. If you have an existing file (e.g Lua, PNG, JPEG etc) then click "Add existing file" instead. These files won’t be copied to the project folder. | If you want to add a Lua file here, right click on the project name and click on "Add a new file". This will add a new Lua file to the project. If you have an existing file (e.g Lua, PNG, JPEG etc) then click "Add existing file" instead. These files won’t be copied to the project folder. | ||
| Line 32: | Line 41: | ||
The output pane will give you valuable information when you run your project in a player. For one you will see which assets are transferred to the player. Also you will see error messages from Lua in the output panel. | The output pane will give you valuable information when you run your project in a player. For one you will see which assets are transferred to the player. Also you will see error messages from Lua in the output panel. | ||
| + | |||
| + | [[File:OutputPane.png]] | ||
=== Code Panel === | === Code Panel === | ||
The code pane is your playground where you create your magic. Means there you type in the Lua code that creates the application of your dreams. It supports syntax color highlighting which depends on the actual code. Comments in Lua are colored differently from string values or Lua keywords. | The code pane is your playground where you create your magic. Means there you type in the Lua code that creates the application of your dreams. It supports syntax color highlighting which depends on the actual code. Comments in Lua are colored differently from string values or Lua keywords. | ||
| + | |||
| + | [[File:Codearea.png]] | ||
==== File Tabs ==== | ==== File Tabs ==== | ||
| − | For every file you have currently opened in Gideros Studio, there will be a tab with its name above the code area. | + | For every file you have currently opened in Gideros Studio, there will be a tab with its name above the code area. |
| + | |||
| + | [[File:Codearea2.png]] | ||
| + | |||
| + | To navigate between this files, just click on the name and the code area will change to this file. If you want to close the file, just click on the little X next to the name of the file. | ||
==== Bookmarks ==== | ==== Bookmarks ==== | ||
| − | If you have bookmarked a line or more in your code, the gutter on the left, which shows the line numbers by default, will show little triangles to indicate that a bookmark was set there. | + | If you have bookmarked a line or more in your code, the gutter on the left, which shows the line numbers by default, will show little triangles to indicate that a bookmark was set there. |
| + | |||
| + | [[File:Bookmarks.png]] | ||
| + | |||
| + | To set, remove and navigate between the bookmarks, use the icons on the toolbar. | ||
| + | |||
| + | [[File:Bookmarks2.png]] | ||
==== Auto-completion ==== | ==== Auto-completion ==== | ||
| Line 51: | Line 74: | ||
=== Running Your Application on [[Gideros Player]] === | === Running Your Application on [[Gideros Player]] === | ||
| − | To get your first sample script running in the Gideros desktop player, you need to start it actually. The fastest way is to click on that little game controller icon in the toolbar. Gideros Studio will now start the GiderosPlayer application and shortly you should see the player on your desktop. | + | To get your first sample script running in the Gideros desktop player, you need to start it actually. The fastest way is to click on that little game controller icon in the toolbar. Gideros Studio will now start the GiderosPlayer application and shortly you should see the player on your desktop. |
| + | |||
| + | [[File:Desktopplayer.png]] | ||
| + | |||
| + | The player will start in the last chosen orientation, resolution and zoom factor. Please note that the Start and Stop icons become active when a linked player is running. | ||
| + | |||
| + | [[File:Startandstop.png]] | ||
| + | <br/> | ||
| + | |||
| + | |||
| + | |||
| + | |||
| + | |||
| + | |||
| + | === Output Panel (Advanced)=== | ||
| + | |||
| + | The output panel actually understands HTML text, so you can send commands to colour text, etc.<br/> | ||
| + | Here is an example to add a new type of 'print' command called 'debug' that outputs text in red: | ||
| + | <syntaxhighlight lang="lua"> | ||
| + | function debug(t) | ||
| + | print([[<font color="#f48">]]..string.gsub(t or "","[}{\">/<'&]", {["&"]="&",["<"] ="<",[">"] = ">",['"'] = """,["'"] = "'",["/"] = "/"}).."</font>") | ||
| + | end | ||
| + | debug("This is a test") | ||
| + | </syntaxhighlight> | ||
| + | |||
| + | |||
| + | Here is an example that outputs a table: | ||
| + | <syntaxhighlight lang="lua"> | ||
| + | function printTable(t) | ||
| + | local m="<table><tr><th>Key</th><th>Value</th></tr>" | ||
| + | for key,value in pairs(t) do | ||
| + | m=m.."<tr><td>"..(key or "").."</td><td>"..(value).."</td></tr>" | ||
| + | end | ||
| + | print(m.."</table>") | ||
| + | end | ||
| + | printTable({"red","blue","green"}) | ||
| + | </syntaxhighlight> | ||
| + | |||
| + | |||
| + | === Debug Tools === | ||
| + | |||
| + | This section of the toolbar contains debug tools: | ||
| + | [[File:Debug_controls.png]] | ||
| + | #Start Debug Mode | ||
| + | #Resume | ||
| + | #Step Over | ||
| + | #Step Into | ||
| + | #Step Return | ||
| + | |||
| + | |||
| + | If you want to debug your project you first need to add breakpoints by clicking on the left of the line number in your Code Panel (the big red dot marks a breakpoint) | ||
| + | |||
| + | [[File:Breakpoint.png]] | ||
| + | |||
| + | Then open Gideros Player and run the project in Debug Mode by clicking the bug icon [[File:Run_debug_mode.png]] | ||
| + | |||
| + | |||
| + | The code will pause execution on the breakpoints you placed earlier ( the arrow shows where it has paused) | ||
| + | |||
| + | [[File:Breakpoint_triggered.png]] | ||
| − | + | You can watch variable values by hovering them inside the Code Panel with your mouse: available values will appear as a tooltip | |
| + | [[File:Debug_watch.png]] | ||
| − | To | + | To resume code execution use the debug tools: hovering each button in the toolbar will tell you what it does. |
| + | [[File:Debug_step_controls.png]] | ||
| − | Gideros | + | === Profile Code === |
| + | This button will run your project while profiling it: [[File:Profile_code.png]]. | ||
| + | As soon as you stop code execution an HTML page will open in your browser with a report from the Gideros Profiler | ||
Latest revision as of 14:29, 13 July 2023
Gideros Studio IDE is written in Qt, using Qt Creator IDE and SDK.
Gideros Studio IDE
Gideros Studio comes with an IDE, enabling faster development of applications. Gideros Studio helps you organize resources, prevent mistakes and provide shorter ways throughout development process. During the build, Gideros Studio translates your code from Lua to native code of the targeted platform.
When you start Gideros Studio, it opens in the welcome mode and shows the dashboard. Here you can do the following:
- Create and open projects
- Read Getting Started Guide
- Read Reference Manual
- Open all recent projects and sessions
- Open tutorials and 30+ example projects
Menu Organisation
The menu organization is straightforward and easy to understand. Below, you can see each menu and what they do.
- File menu: Here you can open, save, close a project, or maintain your recent projects. This is also the place where you export your code to Eclipse or XCode.
- Edit menu: Provides a basic mechanism of editing actions, like undo, redo, cut, copy, paste, find and more.
- Compile menu: This menu is used to check the syntax of your code, by compiling the project and writing the possible errors to the output console.
- Player menu: Runs Gideros Player on the desktop, or starts the application on the player (which can be on the mobile device, or desktop). If you want to test your application, you need to install the player on the device, which is explained in the following chapters.
- Help: Includes a link to Developer Center and Reference Manual (API documentation).
Note that you can reach many menu items by using one of the Menu Shortcuts.
Project Panel
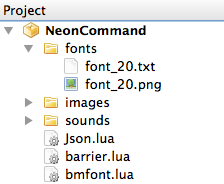
The project pane shows the project files, including all Lua files and assets like graphics and sound. All files added to the project can be seen here.
If you want to add a Lua file here, right click on the project name and click on "Add a new file". This will add a new Lua file to the project. If you have an existing file (e.g Lua, PNG, JPEG etc) then click "Add existing file" instead. These files won’t be copied to the project folder.
Output Panel
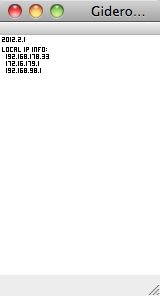
The output pane will give you valuable information when you run your project in a player. For one you will see which assets are transferred to the player. Also you will see error messages from Lua in the output panel.
Code Panel
The code pane is your playground where you create your magic. Means there you type in the Lua code that creates the application of your dreams. It supports syntax color highlighting which depends on the actual code. Comments in Lua are colored differently from string values or Lua keywords.
File Tabs
For every file you have currently opened in Gideros Studio, there will be a tab with its name above the code area.
To navigate between this files, just click on the name and the code area will change to this file. If you want to close the file, just click on the little X next to the name of the file.
Bookmarks
If you have bookmarked a line or more in your code, the gutter on the left, which shows the line numbers by default, will show little triangles to indicate that a bookmark was set there.
To set, remove and navigate between the bookmarks, use the icons on the toolbar.
Auto-completion
The code pane of Gideros Studio also supports you with an auto completion feature which you will love. Depending on what you type in, it will make suggestions on what could be inserted and you can chose from a list box a method/function that you would like to use. If you don’t want that, just press the escape key and the box will close automatically.
Running Your Application on Gideros Player
To get your first sample script running in the Gideros desktop player, you need to start it actually. The fastest way is to click on that little game controller icon in the toolbar. Gideros Studio will now start the GiderosPlayer application and shortly you should see the player on your desktop.
The player will start in the last chosen orientation, resolution and zoom factor. Please note that the Start and Stop icons become active when a linked player is running.
Output Panel (Advanced)
The output panel actually understands HTML text, so you can send commands to colour text, etc.
Here is an example to add a new type of 'print' command called 'debug' that outputs text in red:
function debug(t)
print([[<font color="#f48">]]..string.gsub(t or "","[}{\">/<'&]", {["&"]="&",["<"] ="<",[">"] = ">",['"'] = """,["'"] = "'",["/"] = "/"}).."</font>")
end
debug("This is a test")
Here is an example that outputs a table:
function printTable(t)
   local m="<table><tr><th>Key</th><th>Value</th></tr>"
   for key,value in pairs(t) do
      m=m.."<tr><td>"..(key or "").."</td><td>"..(value).."</td></tr>"
   end
   print(m.."</table>")
end
printTable({"red","blue","green"})
Debug Tools
This section of the toolbar contains debug tools:
![]()
- Start Debug Mode
- Resume
- Step Over
- Step Into
- Step Return
If you want to debug your project you first need to add breakpoints by clicking on the left of the line number in your Code Panel (the big red dot marks a breakpoint)
Then open Gideros Player and run the project in Debug Mode by clicking the bug icon ![]()
The code will pause execution on the breakpoints you placed earlier ( the arrow shows where it has paused)
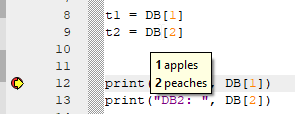
You can watch variable values by hovering them inside the Code Panel with your mouse: available values will appear as a tooltip

To resume code execution use the debug tools: hovering each button in the toolbar will tell you what it does.
![]()
Profile Code
This button will run your project while profiling it: ![]() .
As soon as you stop code execution an HTML page will open in your browser with a report from the Gideros Profiler
.
As soon as you stop code execution an HTML page will open in your browser with a report from the Gideros Profiler


