Difference between revisions of "Profiling"
(→Example: replaced html code by images) |
|||
| Line 39: | Line 39: | ||
This code outputs: | This code outputs: | ||
| − | |||
| − | |||
| − | |||
| − | |||
| − | |||
| − | |||
| − | |||
| − | |||
| − | |||
| − | |||
| − | |||
| − | |||
| − | |||
| − | |||
| − | |||
| − | |||
| − | |||
| − | |||
| − | |||
| − | |||
| − | |||
| − | |||
| − | |||
| − | |||
| − | |||
| − | |||
| − | |||
| − | |||
| − | |||
| − | |||
| − | |||
| − | |||
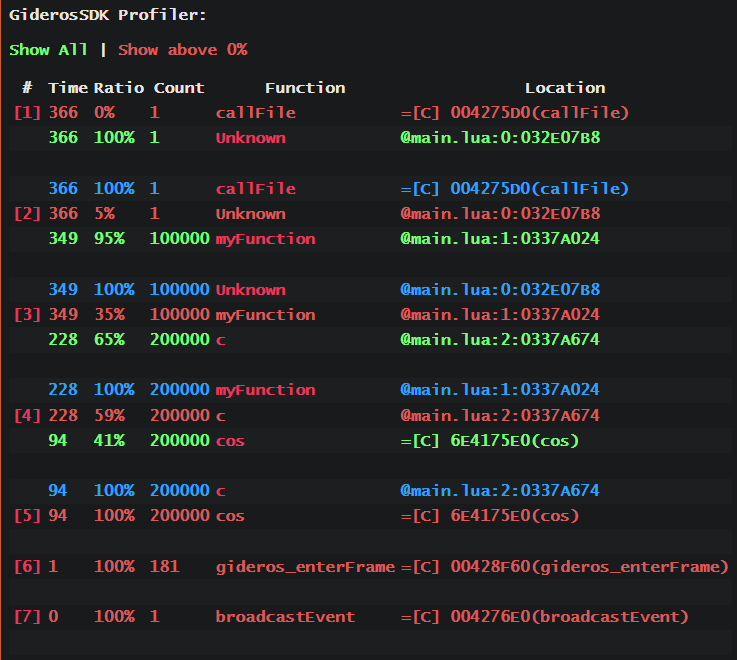
| + | [[File:profiling01.png]] | ||
This is a list of all functions ran by the code sorted by CPU usage (highest first). The first chunk is about a function called ''callFile''. It is an internal Gideros Function which loads each lua file. In our case it was used to launch main.lua, which corresponds to block [2]. | This is a list of all functions ran by the code sorted by CPU usage (highest first). The first chunk is about a function called ''callFile''. It is an internal Gideros Function which loads each lua file. In our case it was used to launch main.lua, which corresponds to block [2]. | ||
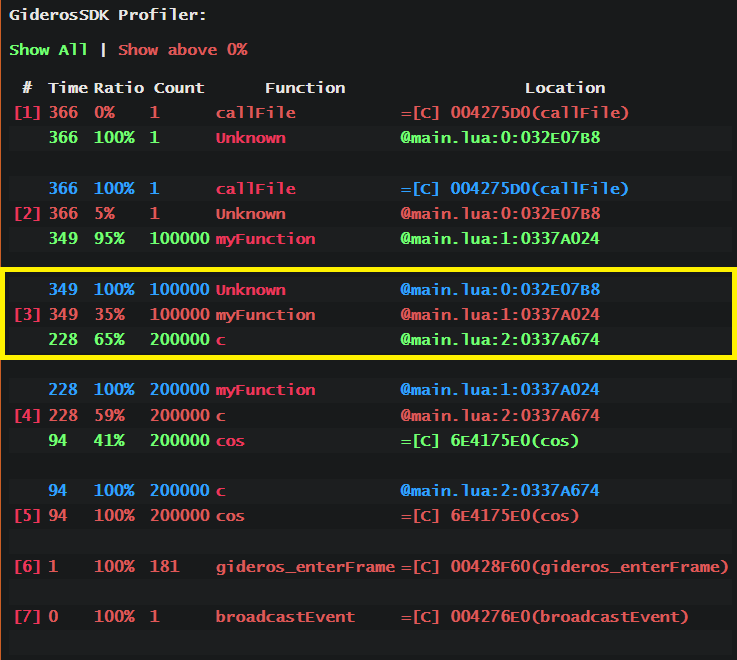
Let's focus on our function ''myFunction'', we can see it is covered by block [3]: | Let's focus on our function ''myFunction'', we can see it is covered by block [3]: | ||
| − | |||
| − | |||
| − | |||
| − | |||
| − | |||
| − | |||
| − | |||
| − | |||
| − | |||
| − | |||
| − | |||
| − | |||
| − | |||
| + | [[File:profiling01B.png]] | ||
| − | So the function ''myFunction'' took, as expected, most of the processing time. Figures tell us that it was called 100,000 times and consumed | + | So the function ''myFunction'' took, as expected, most of the processing time. Figures tell us that it was called 100,000 times and consumed 349ms on CPU. We also learn that it was called from an unnamed function located at main.lua:0, which is the toplevel lua code of main.lua file, and that all the time (100%) spent in myFunction was due to being called by main.lua. |
| − | More interestingly, we discover that 65% of the time ( | + | More interestingly, we discover that 65% of the time (228ms) was spent in calls to function ''c'' located at line main.lua:2, and that c was called 200,000 times, twice per call. |
| − | The next chunk is about function ''c'': | + | The next chunk is about function ''c'': 41% of the time of ''c'' was spent in math.cos(), and 59% in the function itself. |
We know that calling a function is expensive, and that ''c'' function is rather simple. Lets try to inline it: | We know that calling a function is expensive, and that ''c'' function is rather simple. Lets try to inline it: | ||
| Line 105: | Line 62: | ||
Now profiler report looks like this: (truncated) | Now profiler report looks like this: (truncated) | ||
| − | |||
| − | |||
| − | |||
| − | |||
| − | |||
| − | |||
| − | |||
| − | |||
| − | |||
| − | |||
| − | |||
| − | |||
| − | |||
| − | |||
| − | |||
| − | |||
| + | [[File:profiling02.png]] | ||
| − | ''myFunction'' is already faster: | + | ''myFunction'' is already faster: 56ms now where we had 349ms before. |
We still call math.cos two times. Lets make it (and math.pi) local. | We still call math.cos two times. Lets make it (and math.pi) local. | ||
| Line 135: | Line 77: | ||
Now the profiler report: | Now the profiler report: | ||
| − | |||
| − | |||
| − | |||
| − | |||
| − | |||
| − | |||
| − | |||
| − | |||
| − | |||
| − | |||
| − | |||
| − | |||
| − | |||
| + | [[File:profiling03.png]] | ||
We saved time in ''myFunction'', while ''cos()'' took the same time. | We saved time in ''myFunction'', while ''cos()'' took the same time. | ||
| Line 161: | Line 91: | ||
Profiler report: | Profiler report: | ||
| − | |||
| − | |||
| − | |||
| − | |||
| − | |||
| − | |||
| − | |||
| − | |||
| − | |||
| − | |||
| − | |||
| − | |||
| − | |||
| + | [[File:profiling04.png]] | ||
We saved a few more precious milliseconds! | We saved a few more precious milliseconds! | ||
Revision as of 07:14, 26 November 2021
The Ultimate Guide to Gideros Studio
Profiling
Gideros comes with an integrated native Lua profiler.
For those who don't know what is a code profiler, it is a tool that measures code effectiveness and outputs statistics about the CPU usage: number of times each function was called, how much time it took to execute, where it was called from.
Gideros provides two means of enabling profiling:
- by launching a profiling session directly through 'Profile' menu item or toolbar icon from Gideros Studio
- by calling Core.profiler* API from Lua
In the former case, Gideros Studio will display the profiling results when the stop button is hit in Gideros Studio toolbar. In the latter, you have to handle profiling data collection and display by yourself.
Note that even if you started profiling through Gideros Studio, you can still use Core.profiler* API within your code.
Available Gideros profiling API:
- Core.profilerStart(), which instructs Gideros to start collecting profiling data
- Core.profilerStop(), which pause collecting
- Core.profilerReset(), which clears collected data
- Core.profilerReport(), which returns a table containing collected profiling data
Example
Let's see how profiling can help us, suppose you are running the following code:
local function myFunction(a)
	local function c(a) return math.cos(a*math.pi/180) end
	return c(a)+c(a+1)
end
and happen to use it very often. It is far from being optimized (on purpose, right) and turns out to be slow. How can we do better?
Let's ask the profiler how does the code perform, say we want to run it 100,000 times:
for i=1,100000 do myFunction(i) end
This code outputs:
This is a list of all functions ran by the code sorted by CPU usage (highest first). The first chunk is about a function called callFile. It is an internal Gideros Function which loads each lua file. In our case it was used to launch main.lua, which corresponds to block [2].
Let's focus on our function myFunction, we can see it is covered by block [3]:
So the function myFunction took, as expected, most of the processing time. Figures tell us that it was called 100,000 times and consumed 349ms on CPU. We also learn that it was called from an unnamed function located at main.lua:0, which is the toplevel lua code of main.lua file, and that all the time (100%) spent in myFunction was due to being called by main.lua.
More interestingly, we discover that 65% of the time (228ms) was spent in calls to function c located at line main.lua:2, and that c was called 200,000 times, twice per call.
The next chunk is about function c: 41% of the time of c was spent in math.cos(), and 59% in the function itself.
We know that calling a function is expensive, and that c function is rather simple. Lets try to inline it:
local function myFunction(a)
	return math.cos(a*math.pi/180)+math.cos((a+1)*math.pi/180)
end
Now profiler report looks like this: (truncated)
myFunction is already faster: 56ms now where we had 349ms before.
We still call math.cos two times. Lets make it (and math.pi) local.
local function myFunction(a)
	local cos=math.cos
	local pi=math.pi
	return cos(a*pi/180)+cos((a+1)*pi/180)
end
Now the profiler report:
We saved time in myFunction, while cos() took the same time.
What if we use Gideros deg to rad operator instead of math.pi and 180 constant?
local function myFunction(a)
	local cos=math.cos
	return cos(^<a)+cos(^<(a+1))
end
Profiler report:
We saved a few more precious milliseconds!
Conclusion
As you can see, the profiler is a useful tool to spot CPU bottlenecks in your app.
Sometimes a few minor changes in the code can make a big difference. In general, avoid table access, avoid function calls, avoid duplicate computations.
PREV.: File system
NEXT: Hardware and OS


